Getting started
Plan your first analysis.
Start with the records you already have. Answer a few questions to find a scope you can run and see what to bring.
Your answers so far
Nothing is uploaded here and no answer is stored. Not sure is a real answer.
What you can learn now
What the records you already hold support, before anyone gathers anything new.
The minimum for your question
A short list, tied to the scope you chose rather than to everything we can read.
What more would make possible
What each further record changes about the method, and what it does not.
Who has to help
The two or three people the scope needs, and who approves sharing records.
Your starting plan
What a first analysis can show
Typical results include the four measures below, separated into the activity itself, the suppliers it buys from and the household spending its wages support. Which of them an analysis can report depends on the scope and the records behind it.
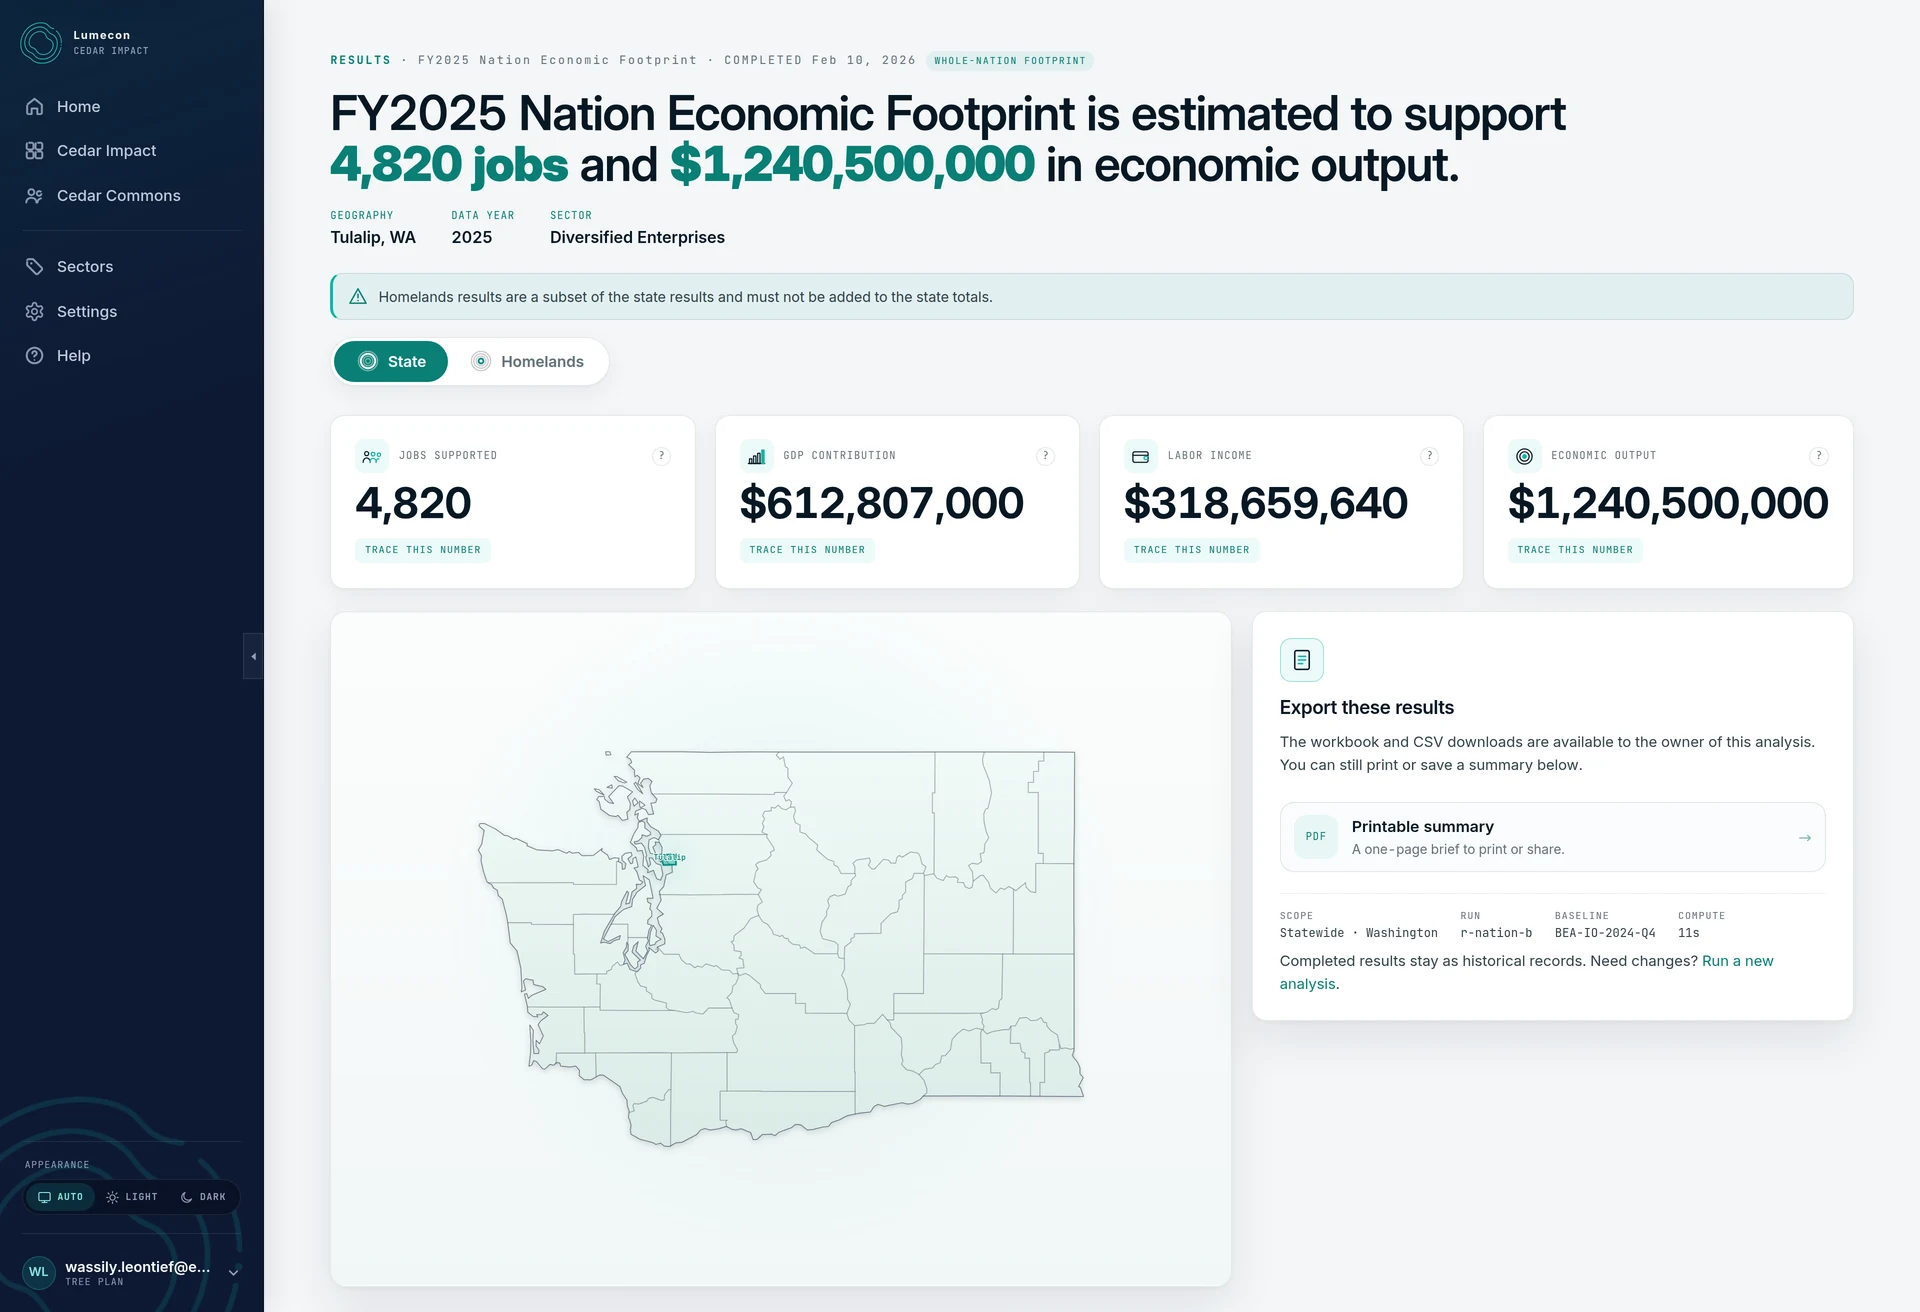
Jobs supported
Never jobs created: a contribution analysis has no counterfactual.
Labor income
Wages, salaries and proprietor income.
Value added
The contribution to regional GDP.
Economic output
Total production supported in the region.
Labor income is a component of value added, which is a component of economic output. They are layers of the same activity, so they are never added together. See the glossary for each term in full.
What more records would let you ask
Each of these answers a question the analysis cannot otherwise reach. Choose one to see what it supports. More information can move an estimate in either direction, narrow what the analysis can support, or surface double counting.
How is our activity distributed across the places we operate?
Bring records separated by entity and work location
Each operation is reported in its own sector, and the region is built from the places work is actually performed rather than from an assumed split across operations.
One primary sector is carried per operation, so operations that should be reported separately are recorded separately.
Available today.
Can we combine our entities without counting the same activity twice?
Bring a listing of transactions between the entities in scope
Supports combining entities while removing activity already counted inside another entity in the same boundary.
Handled today as a preparation step before intake, not inside the model.
How does money move between our enterprises and our government?
Bring enterprise distributions and government spending records
Supports reporting government activity and enterprise proceeds as distinct accounts, with transfers between them treated as transfers.
Available today, though several government detail fields are not yet carried end to end through the product.
How has this changed over time?
Bring comparable records across years
Supports reporting change over time, limited by consistent coverage and consistent accounting between the years.
Available today. One analysis covers one year; several years run as a series.
How do we explain this to the people it is for?
Bring interviews, photographs and other contextual material
Supports interpretation and reporting. It does not enter the calculation.
Available today, in reporting rather than in the model.
How much of what we buy is actually bought locally?
Bring vendor and subcontractor spending with usable locations
Would replace the modeled estimate of what is purchased locally with observed purchasing, and would separate subcontracted work from work performed in house.
Future work. Local purchasing is estimated from regional trade data today, and vendor records are not a model input.
Prepare your organization for an analysis
The work stalls on coordination more often than on data. Four things make it go smoothly, and none of them has to be settled before you start.
A project lead
One person who keeps the work coordinated, brings in whoever is needed, and makes sure an open question does not quietly disappear.
Not necessarily the most senior person, and they do not have to hold any of the records themselves.
A clear first question
What the organization needs to understand or communicate first, written in a sentence someone outside the project would recognize.
One question is enough to start. The second is easier once the first is answered.
The right record holders
Whoever can reach the finance, payroll, operations, contracts or program records the analysis draws on.
Usually several people across several offices, which is normal and worth mapping early.
The right approval path
Whoever can authorize records being shared, and whether a review has to happen before they move.
The person who holds a record and the person who can release it are often not the same person.
You do not need every record, or every person, before you begin. It helps to know who can help when the project needs them.
What a project team looks like
A composite of how organizations that run these analyses well are arranged. One person may hold several of these, and a small organization often has three people rather than six.
Project lead Coordination
Keeps the project moving, decides whom to involve, and tracks what is still unanswered.
Executive sponsor Authority
Settles scope, priority and access questions that need someone able to decide them.
Finance or accounting Records
Statements, budgets and the figures every other number is built from.
Payroll or human resources Records
Employment and compensation, which is where jobs and labor income come from.
Operations or enterprise leads Knowledge
How a specific operation actually runs, which no document states plainly.
Governance liaison Approval
The Council, board, enterprise leadership or legal route, where one is required before records are shared.
Some organizations need leadership, board, Council or legal review before records are shared. Naming that step at the start means the timeline reflects how the organization actually works, instead of the project discovering it halfway through.
The onboarding call works through whichever of these is unsettled. What the call covers.
Working with a consultant? Share this guide with your client, or begin a project together in Lumecon.
Start with the records you already have
Bring what exists. We would rather read the report you already produce than have you build a spreadsheet for us, and we will tell you what it supports before you spend time reformatting anything.
Latest financial statement for the selected operations
Carries economic output and the reporting year every other figure is matched to.
Alternatives, and who usually holds it
An internal statement or trial balance, where audited figures are not final yet.
Finance office or controller
Payroll summary for the same year
Labor income drives the household spending the analysis reports.
Alternatives, and who usually holds it
A W-3, or four quarterly 941s covering the same year, or the payroll line of the financial statement.
Payroll or human resources
Employee count for the same year
Jobs are reported directly, and the count is checked against payroll.
Alternatives, and who usually holds it
A point in time headcount, labeled with the date it was taken, or the count already on the payroll summary.
Human resources
These three, for one year, cover the common case. What else a particular analysis needs depends on its scope, which is what the questions above work out. Some of what looks like a separate request is often already inside a record you hold.
Nothing is uploaded here. Records are shared inside the product, where access is controlled and every file stays connected to the analysis it supports.
Help getting started
We can help you choose a starting point.
Bring one report you already have. An economist will tell you what it supports, which gaps matter for your question and which do not.
Arrange an onboarding callGoes to a short form. The team replies by email to arrange a time.
Agree a question worth answering
One question, and who it is for, written in a sentence you would recognize.
Look at what you already have
Bring one existing report. We say what it supports and what it does not.
Name what comes next
The records or decisions still open, and who in your organization holds them.
Reference
How coverage is reported
An analysis reports what it observed and what it assumed. Coverage tells you which records are represented. It does not measure overall model accuracy, and it is never a confidence score.
The indicators, their denominators and how estimation is flagged are set out in the methodology.
8 of 10
selected operations have records in hand. The denominator is the agreed list of operations, so the figure changes when the scope does.
Next step
Start with one question, not everything at once.
Send one report you already have. An economist will tell you what it supports, which gaps matter for your question and which do not.
Or write to contact@lumecon.ai.