Why Lumecon

Serious economic analysis should be within reach.

Every organization has an economic impact. Far fewer can describe it. The software has been expensive, the study has meant a consultant and a calendar, and the result has often arrived as a number with nothing behind it. Lumecon exists so that an organization can understand and explain its own economic contribution, and keep the evidence for it.

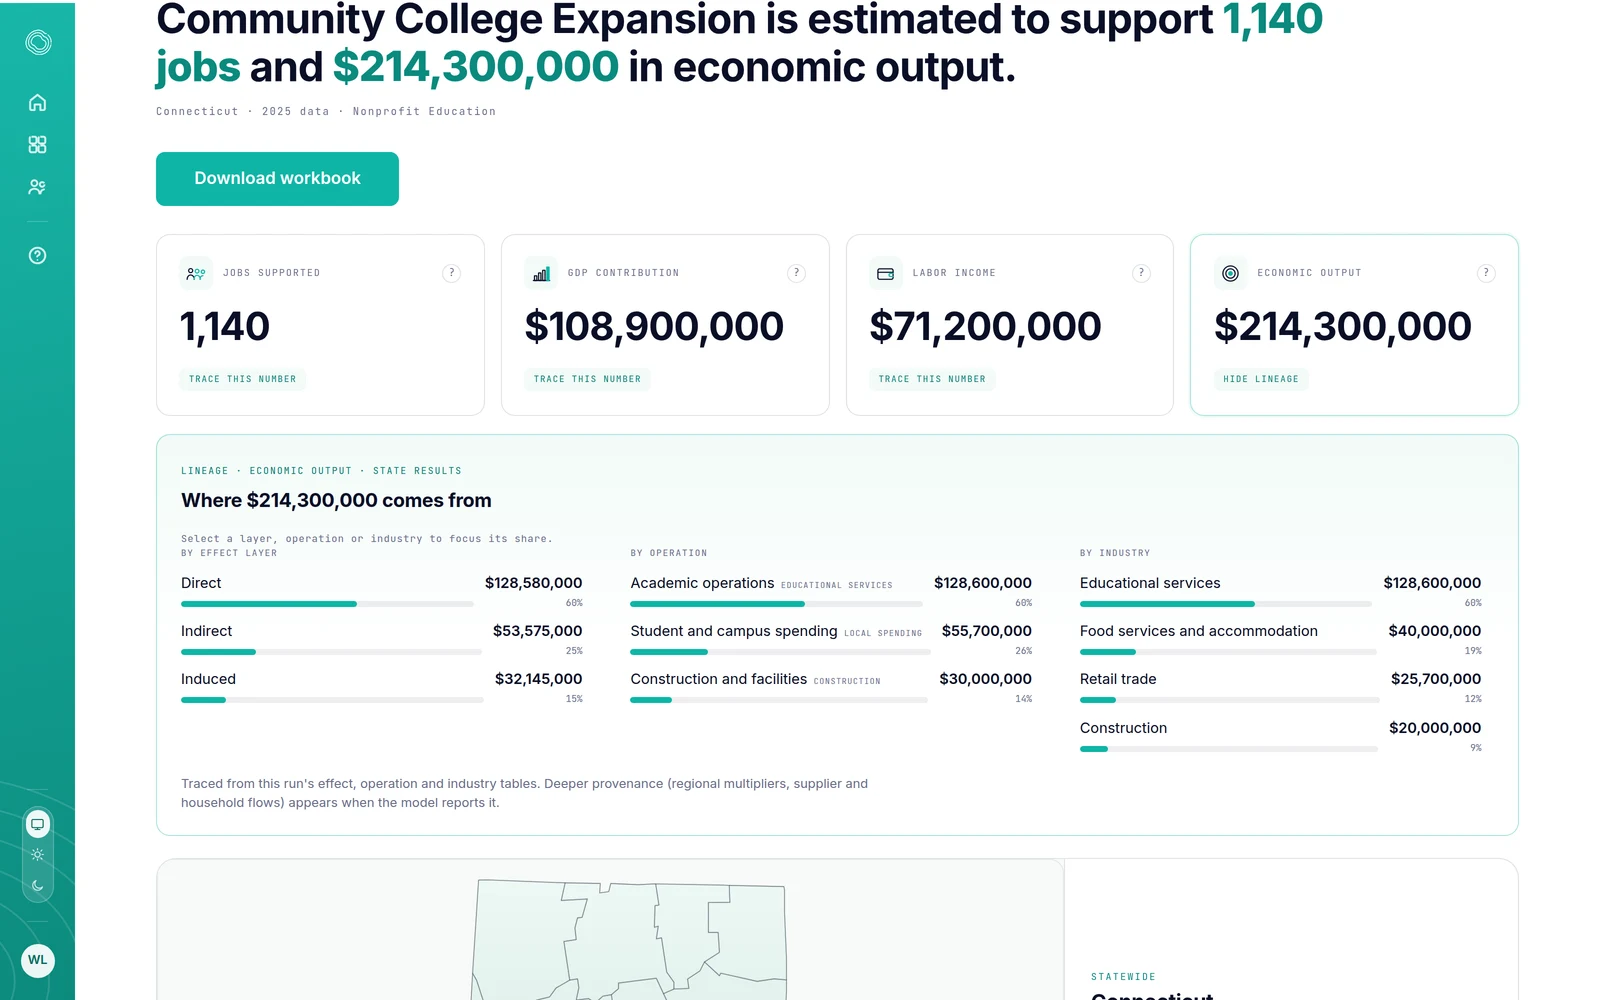
A completed Lumecon analysis reporting jobs, GDP contribution, labor income and economic output, with the lineage panel open beneath it breaking economic output into direct, indirect and induced layers and into the operations and industries that produce them. Shown with illustrative sample data.
A result, and the evidence for it, in the same view. Illustrative sample data.

A price you can plan around.

The prices are published on the site, not quoted per organization, so a budget can be written before a conversation happens.

$1,000a year

Sprout, for one analyst. Paid plans start here.

  • The same model on every paid plan

    The plans differ in how many people use them and what they share, never in the economics. Nobody buys a better multiplier.

  • Unlimited analyses

    Analyses are not metered, so a second look at a scenario costs nothing and a yearly update is not a new purchase.

  • Every supported U.S. geography

    Counties, states, the nation, reservations and trust lands. Geography is not sold as an add-on.

Client work is licensed at two levels: Sapling for a consultancy working within ten seats, reassigned as engagements change, and Tree for one past ten. An organization-wide license — a university, bank, CDFI or agency — is Tree, where seats are unlimited across the organization. Sapling is $2,500 a year, Tree is $7,500. See every plan and what it includes.

Spend more time on the economic questions.

Most of the effort in an impact study is not the economics. It is finding the records, deciding what each figure means, and rebuilding an analysis that already existed once. That is the part Lumecon takes on.

Bring the records you already have.

Budgets, audited statements, payroll summaries and program reports go in as they are, rather than being retyped into a template first. Nothing is calculated until a person has reviewed the inputs and the assumptions. How Cedar works.

The intake step of a Lumecon analysis with three operations set up from uploaded documents, and Cedar reporting that two are ready while one is missing a sales figure, asking the person to confirm before anything runs. Shown with illustrative sample data.
Cedar checks the operations against the documents and waits. Illustrative sample data.

The second analysis is not the first one again.

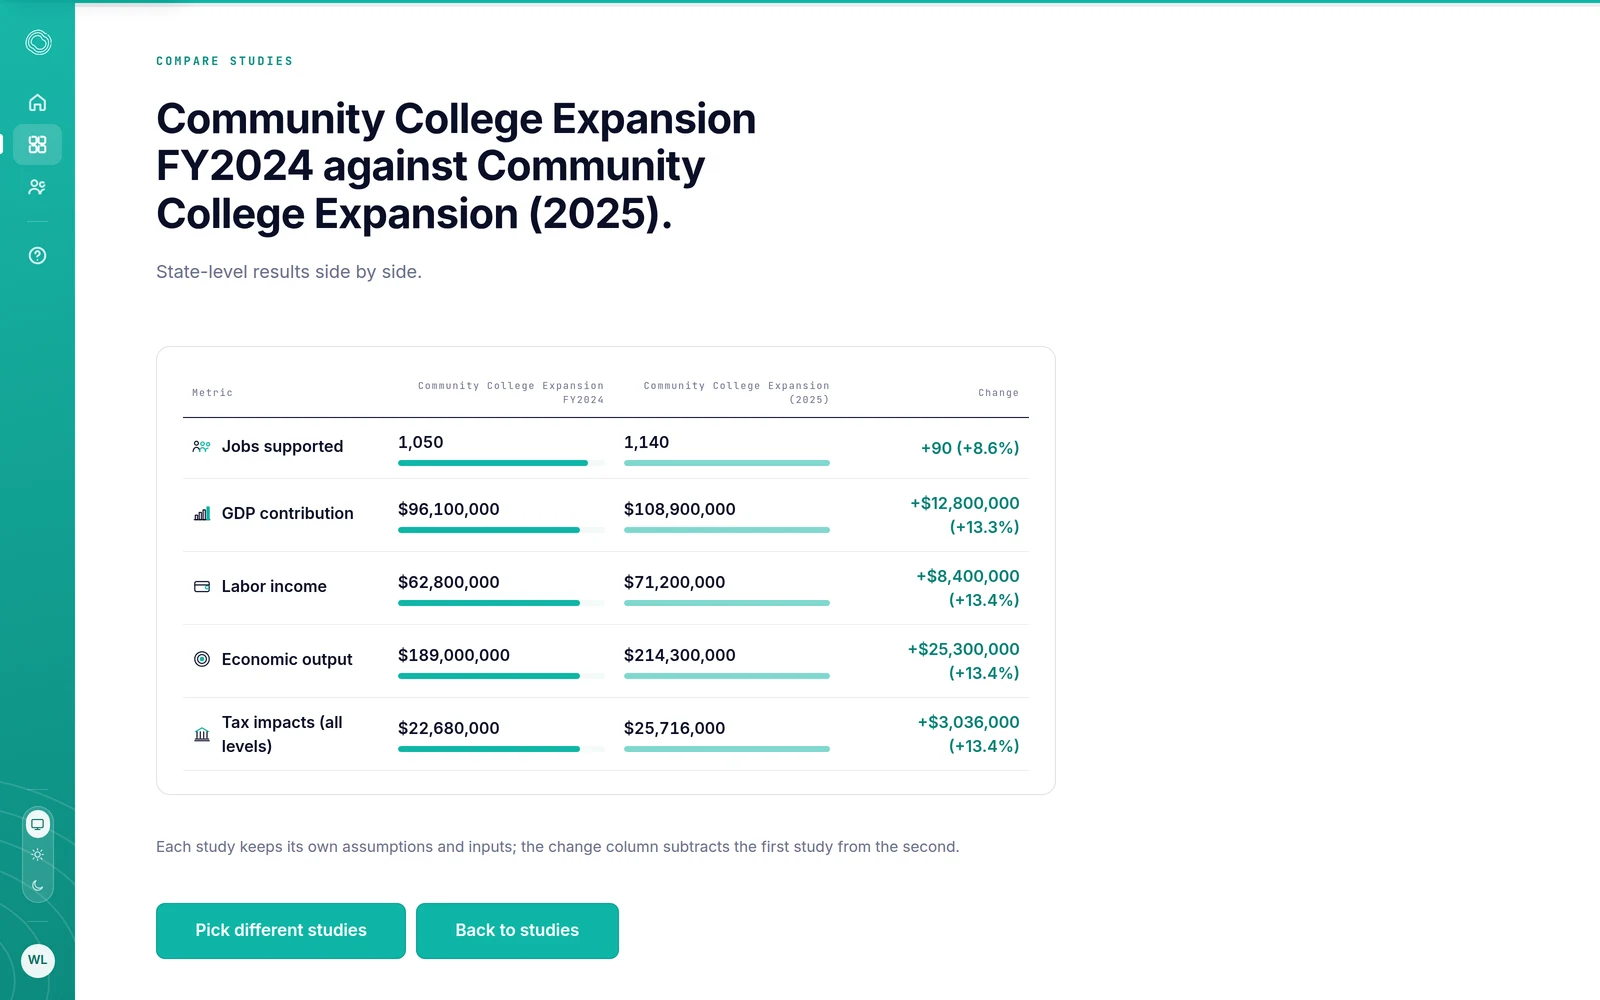
A completed analysis stays with its inputs, assumptions and sources. Next budget cycle you update what changed rather than reassembling the whole thing, and two years or two scenarios can be put side by side in jobs, labor income, GDP contribution, economic output and tax impacts.

The product cannot make other people faster. Approvals, a council agenda and the wait for a figure only one department holds still take the time they take. We have not measured a time saving and do not claim one.
Two fiscal years of a sample analysis side by side, showing the change in jobs, GDP contribution, labor income, economic output and tax impacts between them. Shown with illustrative sample data.
Two years of the same footprint, compared. Illustrative sample data.

See what supports the result.

Every headline figure carries a trace. Here is the one from the analysis at the top of this page, written out: the same total, decomposed two ways, each of which adds up.

Economic output$1,240,500,000

By effect layer

  • Direct$744,300,000

    60% The activity itself.

  • Indirect$310,125,000

    25% The suppliers it buys from.

  • Induced$186,075,000

    15% Household spending its wages support.

By operation

  • Resort and gaming operations$607,845,000

    49% of the total

  • Retail village and leasing$384,555,000

    31% of the total

  • Government and member services$248,100,000

    20% of the total

The inputs carry the same treatment: each one is tagged as reported, apportioned or estimated, so a reviewer can see which figures came from a document and which the model supplied. Exports carry the sources, the assumptions and the full tables. How lineage is constructed.

Illustrative sample analysis, not a customer.

Built with complex organizations in mind.

The organizations that most need an economic account of themselves are often the ones a standard model handles worst: several entities, a government that is also an employer, and a geography that is not a county.

One economy, several sets of books.

  • More than one entity

    A government, its enterprises and its programs are one economy and several sets of books. An analysis can hold them together and still report them apart.

  • Government and enterprise activity together

    Tribal governments are their own category in the classification rather than one line inside Public Administration, because a nation running administration, housing, health and education is understated by that line.

  • Reservation and trust-land geographies

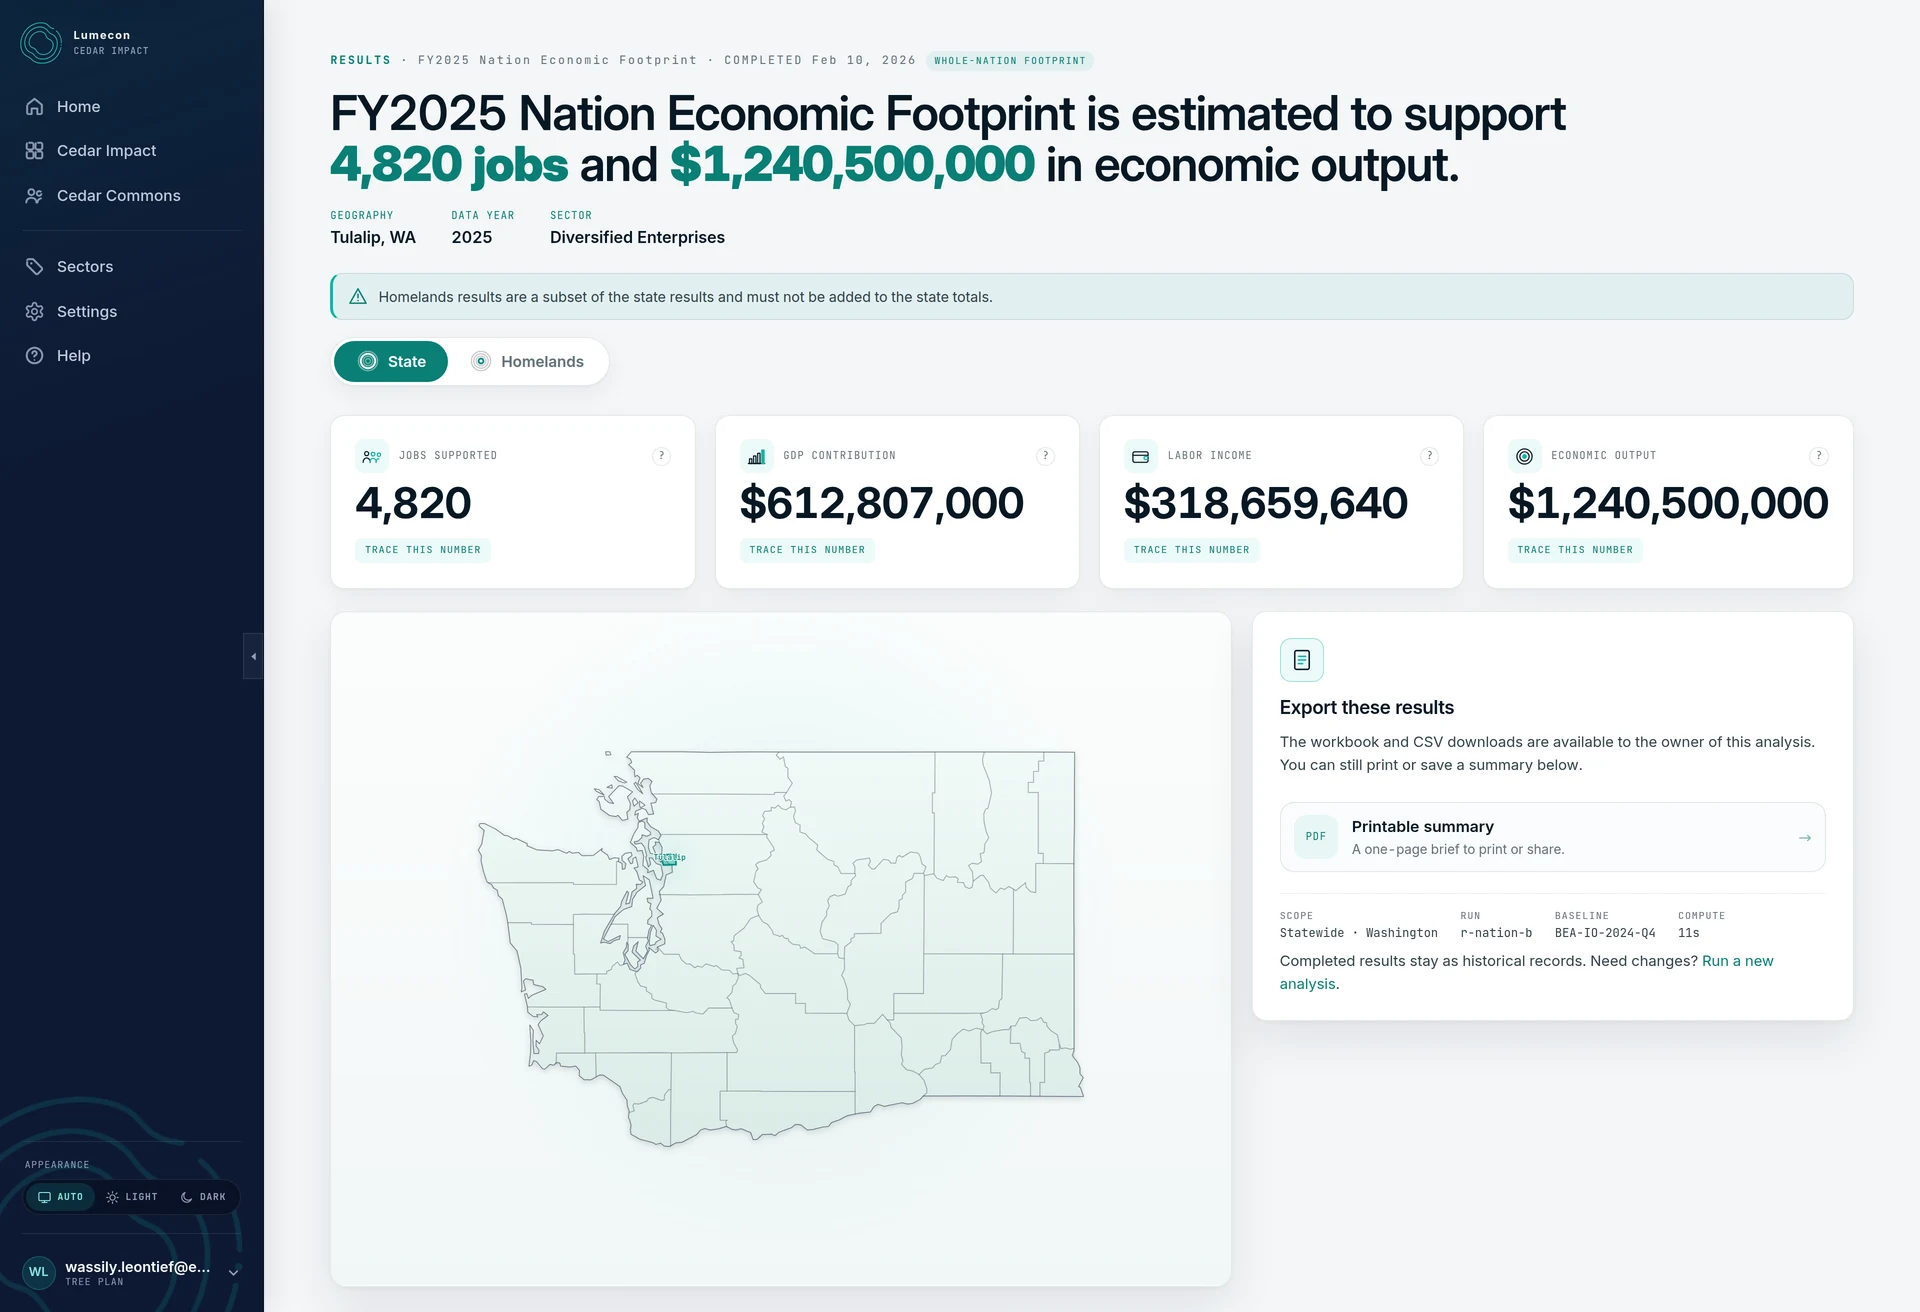
    Homelands are modeled regions with their own characteristics, not a share of a county. Where an analysis covers a state and its homelands, both are reported with the subset relationship stated, so nothing is added twice.

A whole-nation economic footprint reporting jobs, GDP contribution, labor income and economic output, with a control switching between the state scope and the homelands scope and a notice that homelands results are a subset of the state results and must not be added to them. Shown with illustrative sample data.
State and homelands, switchable, with the subset relationship stated on the page. Illustrative sample data.

Check any of this yourself.

  • Method

    The economics, with the equations

    Regionalization, the effect layers, the public sources and their vintages, and a labeled section on what the model assumes and where it stops.

    Read the methodology
  • Comparison

    How Lumecon differs from established platforms

    Input-output analysis is an openly published field, and established platforms and Lumecon draw on the same national statistical system. The differences are the data architecture, the regionalization, the per-figure lineage, reservation and trust-land modeling, the workflow and the price. Lumecon is not affiliated with or endorsed by IMPLAN, REMI or any other platform.

    See the model itself
  • Security

    How organizational information is handled

    Lumecon is formalizing its security program against the AICPA Trust Services Criteria, with a future SOC 2 Type II examination as the target. No SOC 2 examination has been completed and no report is available today. The page states which controls are in place, which are in progress and which are not.

    Read the current status

Start with a question worth answering.

What does this organization contribute to the economy around it, and what is the evidence? Seed access is free during the private beta: bring your documents, build an analysis and see the direct effects. If you are not sure what to ask for yet, the starting guide proposes a scope you can actually run.